Gold Session Clock: a free TradingView indicator that measures gold’s hourly range
Free TradingView indicator for XAU/USD. Shows how much gold usually moves in each hour of the day on your own chart, whether that rhythm is strong right now, and how the Asian session compares with past days. No signals.
Gold Session Clock is a free indicator for TradingView. It measures, on the bars of your own chart, how much gold usually moves in each hour of the day, whether that hourly rhythm is strong or flat right now, and how the Asian session compares with previous days. It draws no buy or sell signals: it tells you when the market tends to move, not where it will go.
Get the code
Leave your email and the code appears right here, ready to copy into TradingView. It works with a free TradingView account.
Here is the code. Copy it, or download it as a file, and follow the three steps below.
How to add it to TradingView
- Open a chart of XAU/USD (any gold symbol works) on a timeframe of 1 hour or lower. 15 minutes is a good balance between detail and history.
- Open the Pine Editor from the panel at the bottom of the chart, select everything in it and paste the code.
- Click Add to chart. Click Save if you want to keep it in your list of indicators.
Pasting a script into your own Pine Editor is allowed on every TradingView plan, including the free one.
What it shows
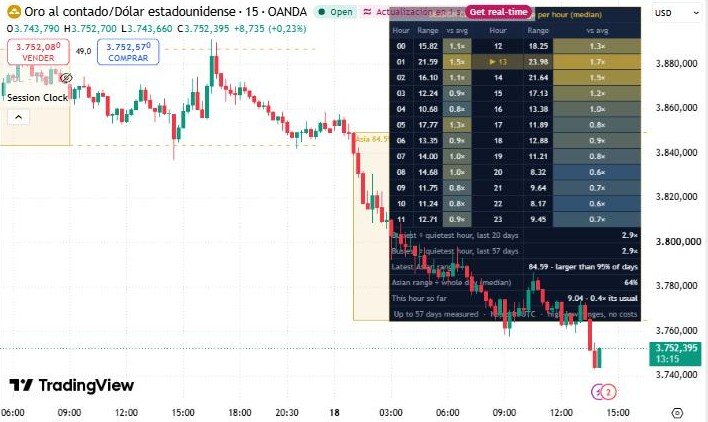
- The hourly range clock. A table with the 24 hours of the day. For each hour, the median high-low range of that hour over the days measured, and how it compares with the average hour. 1.7× means that hour usually moves 1.7 times as much as an average hour.
- Busiest ÷ quietest hour. The ratio between the most active and the least active hour, for the last 20 days and for the whole sample. It tells you whether the usual session rhythm is present right now.
- The Asian range box. The high and low of the Asian session, 00:00 to 08:00 UTC by default, with its size printed on the box and dashed lines that carry the high and low forward.
- The Asian range in context. The latest Asian range against previous days (“larger than 95% of days”), and the median share of the whole day’s range that the Asian session had already covered.
- This hour so far. How much the current hour has moved compared with its usual median.
How to read it
Gold does not move evenly through the day. Most of the range tends to arrive in a few hours, usually around the London open and the New York session, and the hours around the daily rollover are usually the quietest. The table shows that rhythm measured on your own data instead of described in general terms. In the chart above, measured over 57 days up to 18 November 2026, the busiest hour was 13:00 UTC at 1.7 times the average hour, the quietest were 20:00 to 22:00 UTC, and the busiest hour moved 2.9 times as much as the quietest.
The two ratios matter more than any single hour. When the last 20 days show a ratio close to the full sample, the session rhythm is intact. When the recent ratio drops well below it, the market is being driven by news and shocks rather than by the clock, and any idea based on time of day deserves less trust until the rhythm comes back.
The Asian box answers a narrower question: was last night unusually quiet or unusually wide? A very small Asian range leaves most of the day’s movement still ahead; a very large one means much of it may already have happened. Neither tells you the direction.
Practical uses: choosing when to watch the chart, placing a stop with the hour’s usual range in mind, and spotting the hours where costs weigh more because price barely moves. The position size calculator turns a stop distance into a lot size.
What it does not do
- It gives no entries, no exits and no forecast of direction.
- Ranges are high-low ranges in price. They do not include spread, commission or slippage, which matter most in the quiet hours. See spread.
- The sample depends on how much history TradingView loads for your plan. On a 15-minute chart with a free account this is usually 50 to 60 days; the footer of the table shows the number.
- It only works on timeframes of 1 hour or lower.
- It describes the past. The hourly rhythm changes over time, which is why the recent ratio sits next to the full one.
Related
- Forex market hours: the four sessions, the overlap, and the hours worth avoiding.
- Spread: why it widens when liquidity thins.
- Position size calculator.
Frequently asked questions
Is the Gold Session Clock free?
Yes. You leave your email, the code appears on the page, and you paste it into your own TradingView Pine Editor. There is nothing to pay and no account to create on this site.
Does it work with a free TradingView account?
Yes. Adding a script to your own chart from the Pine Editor is allowed on every TradingView plan, including the free one. The free plan loads less history, so the table usually measures 50 to 60 days on a 15-minute chart.
Does it work in MetaTrader?
No. It is written in Pine Script, the language of TradingView, which does not run in MetaTrader 4 or 5.
More in Tools
- Risk calculator: entry, stop and target into size and reward to risk Works from prices rather than pips. Gives stop distance, position size for your risk percentage, and the reward to...
- Lot size calculator: from money at risk to a size your broker accepts Turn the money you are willing to lose and your stop distance into a lot size, rounded down to the volume step....
- Pip calculator: what one pip is worth for your pair and account Pip value for any pair, position size and account currency, including yen pairs and gold. No live rates, so you...
- Position size calculator: balance, risk and stop into a tradeable lot size Enter balance, risk percentage and stop distance and get the position size that makes them consistent. Rounds down...